(United Schmidt Institute of Physics of the Earth, Russian Academy of Sciences, Moscow)
and the Working Group of the GSHAP Region 7
V. Trifonov (Geological Institute, RAS, Moscow, Russia), T.L. Kronrod
(International Institute of Earthquake Prediction Theory and Mathematical
Geophysics, RAS, Moscow, Russia), K.G. Levi (Institute of the Earth Crust,
Siberian RAS Department, Irkutsk, Russia), N.D. Zhalkovsky (Institute of
Geophysics, Siberian RAS Department, Novosibirsk, Russia), V.S. Imaev (Institute
of Geological Sciences, Siberian RAS Department, Yakutsk, Russia), A.I.
Ivastchenko (Institute of Marine Geology and Geophysics, Far East RAS Department,
Yuzno-Sakhalinsk, Russia), V. N. Smirnov (North-East Complex Research Institute,
Far East RAS Department, Magadan, Russia), A.A. Gusev (Institute of Volcanic
Geology and Geochemistry, Petropavlovsk-Kamchatsky, Russia), S.Yu. Balassanian
(National Survey for Seismic Protection of RA, Yerevan, Armenia), A. Gassanov
(Experimental Methodical Geophysical Expedition of the AS, Baku, Azerbaijan),
R.E. Ayzberg (Institute of Geology, Geophysics and Geochemistry, AS, Byelorussia),
T. Chelidze (Institute of Geophysics, AS, Tbilisi, Georgia), A.K. Kurskeev
(Institute of Seismology, Ministry of Science and National AS, Almaty,
Kazakhstan), A.T. Turdukulov (Institute of Seismology, Bishkek, Kyrgyzstan),
A.V. Drumya (Institute of Geophysics and Geology, AS, Kishinev, Moldova),
S.Kh. Negmatullaev (Institute of Seismic Construction and Seismology, AS,
Tadzhikistan), T.A. Ashirov (Institute of Seismology, AS, Ashgabad, Turkmenistan),
B.G. Pustovitenko (Geophysics Institute, AS, Kiev-Simferopol, Ukraine),
K.N. Abdullabekov (Institute of Seismology, AS, Tashkent, Uzbekistan)
Keywords: seismic hazard assessment, Northern Eurasia, earthquakes,
active faults
Abstract
Introduction
The GSHAP Moscow Regional Center was established at the United Schmidt Institute of Physics of the Earth (UIPE) in June 1992, to coordinate the seismic hazard activities of the GSHAP Region 7, covering Northern Eurasia between 30°N-90°N and 20°E-170°W and including the whole territory of Russia, Ukraine, Byelorussia, Moldova, the republics of Caucasus and Central Asia, the contiguous seismically active areas of Rumania, Bulgaria, Iran, Turkey, Afghanistan, Mongolia, China and Japan and the oceanic shelf zones. More than 30 research institutes of the Russian Federation and other CIS-countries participated in these investigations.
Beginning in 1991, comprehensive studies have been conducted at UIPE in the field of earthquake hazard assessment in order to draw a new General Seismic Zoning (GSZ) map of Northern Eurasia (Ulomov, 1992). The new map for the territory of former USSR was completed in 1997 (GSZ-97) in order to replace the one created in 1978. One of the major drawbacks of the GSZ-78 (besides other methodological limitations) was that seismological and other data used in assessing the hazard were extremely heterogeneous, due to the lack of adequate studies, especially in the adjacent areas of foreign countries. For example, the territory of Caucasus had been formerly analyzed without considering the major tectonic structures located to the south in the territories of Iran and Turkey; the same was true for Central Asia, Siberia and the Far Eastern region.
The work conducted for the GSHAP mapping was done in close cooperation with other regions and regional centers. Beginning in 1993 the GSHAP Regional Centers for Northern Eurasia (UIPE, Moscow) and for the Middle East (IIEES, Tehran) have joined efforts in the Crimea-Caucasus-Kopetdagh test area, together with the seismological institutions from the Caucasian republics, Russia, Ukraine, Turkmenistan, Turkey and Iran (Balassanian et al., 1999). For the Central Asia, Mongolia and Far Eastern regions the work was jointly conducted with the GSHAP Center for Central-Southern Asia (SSB, Beijing); joint workshops were held in Beijing (4/1993 and 10/1994) and in Moscow (4/1996 and 9/1997). An international framework was also created for the definition of the earthquake source zones of Central Asia, with participation from Uzbekistan, Kyrgyzstan, Russia, Kazakhstan and Tadzhikistan; a joint workshop was held in Bishkek (9/1995).
Methodology
The first official seismic zoning map of the former USSR territory was compiled in 1937. This map and three following generations of zoning maps were incorporated into seismic building codes in 1957, 1968 and 1978. For many years, all seismic zoning work for the USSR was co-ordinated by the Interdepartemental Council on Seismology and Earthquake Engineering (ICSEE). All these maps were based only on the historical and instrumental information, using an historical deterministic or probabilistic approach, without incorporating adequate seismo-geodynamic or seismo-tectonic models and prognostic elements. As a result, after each strong earthquake occurring in the FSU these maps required upgrading, as it became necessary also for the GSZ-78 map after the destructive earthquakes in Armenia (Spitak, 1988) and in Georgia (Racha, 1991). Other recent surprisingly strong earthquakes occurred in Kazakhstan (Zaysan, 1990), Kyrgyzstan (Suusamyr, 1992) and Russia (Karyakia, 1990 and Neftegorsk, 1995). These earthquakes, with magnitude about 7 or higher and MSK-64 intensity IX and higher, occurred in zones where VII/VIII intensity was expected.
The research conducted in USSR led to new concepts of seismic statistics in the 1950-1960s, Russian scientists being the first to put forward the idea of a genetic two-step seismic zoning and a probabilistic assessment of earthquake hazard (Medvedev, 1947). According to this concept, the first, seismotectonic step involves identification of seismic source zones (abbreviated SSZ below), while the second, engineering step is concerned with the calculation of the seismic effect caused by these at the surface. This two-step model and the probabilistic approach to seismic hazard mapping have become widely accepted also in Western seismology, after the well-known paper of Cornell (1968) and subsequent research on similar lines. Nevertheless, in spite of the high conceptual value of this methodology, it is only the second step of seismic zoning which has received most attention, i.e. the calculation of seismic effect at the surface. The first step, the identification and seismological parameterization of seismic source zones, which deals with deep-seated seismogeodynamic processes and belongs to the competence area of seismologists, geophysicists and geologists, has not developed beyond a largely subjective procedure. Keilis-Borok and other investigators described a more or less formalized approach to identification of quasi-homogeneous SSZs. However, this approach, like similar others which have gained acceptance in recent years, can only be considered as a first approximation to seismotectonic regionalization.
Our study too is based on a two-step approach involving the development of two related predictive models, namely the Source Zone Model and the Seismic Effect Model (Figure 1). This methodology for seismic hazard assessment and seismic zoning - termed Earthquake Adequate Sources Technology (EAST-97; Ulomov, 1987, 1997) - is based on the concepts of (a) probabilistic estimates of source zones by lattice regularization; (b) 3D source zones to adequately reflect the nature of seismicity; (c) the fractal structural-dynamic unity of the medium and of the seismic processes within it; (d) the determination of the upper magnitude threshold in accordance to the size of geoblocks and the intensity of their interactions; (e) a deterministic-probabilistic approach to all input and output data.
For this study three data bank blocks were created (geodynamics, seismicity and strong motion, see Figure1), incorporating various seismological, geophysical and geological databases in digital form: instrumental, historical and pre-historical seismicity; active faults; topography, bathimetry and their gradients; relief of «granite» and «basalt» layers and their gradients; depth of basement; magnetic anomalies; heat flow; Moho depth; anomalies of velocity distribution of seismic waves; Bouguer and depth gravity anomalies; isostatic anomalies and their gradients; earthquake focal mechanisms solution.
The following Working Groups were created (coordinators listed): Earthquake Catalogues and Data Base (Kondorskaya, Ulomov), Neotectonics (Grachev), Active faults (Trifonov, Kozhurin), Seismicity and Seismic Regime (Ulomov, Shumilina, Medvedeva), Seismogeological Taxonomy (Shebalin, Trifonov, Ulomov), Potential earthquake sources (Reissner, Ioganson, Rogozhin)
Earthquake Source Zones (Ulomov, Trifonov), Strong Ground Motion Attenuation
(Gusev, Shumilina), Software for Hazard Calculation (Gusev, Pavlov, Shumilina),
Seismic Hazard Computation and Mapping (Ulomov, Shumilina), Geographical
Information System Implementation (Anderzhznov, Kolesnikov, Ulomov).
Geology and Seismotectonics of the Northern Eurasia
Northern Eurasia covers a vast area, characterized by the intense interactions between several major lithospheric plates and continental blocks: Northern Eurasia, Arabia, Africa, India, E. China, North-America, Pacific. These interactions govern the geological processes and seismicity in this large segment of the Earth. The heterogeneity of the tectonic structure over such a vast area is present at different scales, starting with the Earth crustal scale and ending in small regional subdivisions; it is then necessary to investigate tectonic objects of different hierarchical rank and to distinguish their static and dynamic characteristics.
Northern Eurasia includes three large platforms with very low, diffuse seismicity (East-European or Russian, West-Siberian and Siberian) and several orogenic belts with higher activity (Iran-Caucasus-Anatolia, Central Asia, Altay-Sayany-Baikal region). The Kuril-Kamchatka subduction zone is the most geodynamically and seismically active region of Northern Eurasia with earthquake hypocenters reaching depths of 600 kilometers and more. The platform crust has a 40± 5 km thickness, while in the continental orogenic belts the Moho discontinuity reaches a depth of 60 km and more (i.e. southern-central Asia). The Carpathians and Pamir-Hyndukush relict subduction zones produce intermediate focus earthquakes with depths down to 150 and 300 km respectively.
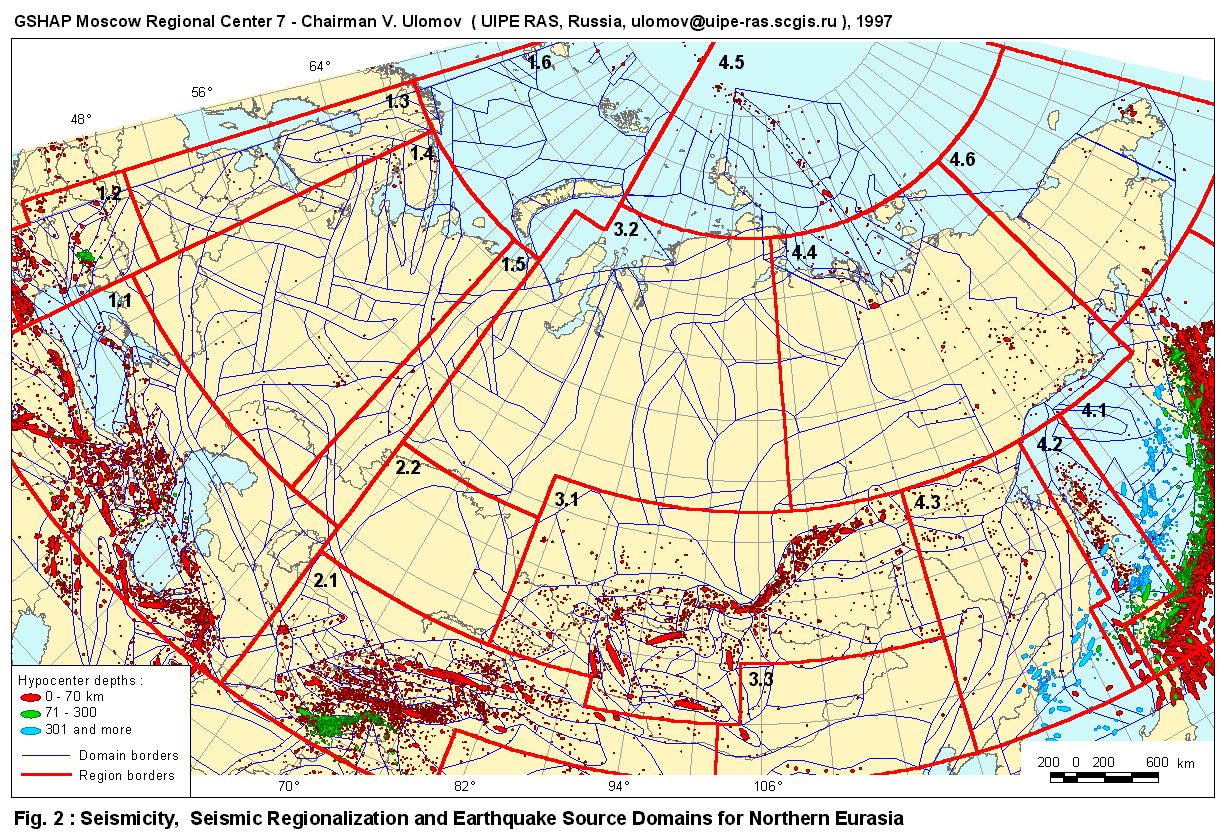
A close connection exists between intracontinental seismic regions and relict subduction zones (Ulomov, 1993, 1994). These regions are the weaker portions of the lithosphere, with extent comparable to present-day island arcs (about 3000 km long), and are to a greater degree subject to deformation processes resulting in higher seismic activity. For this reason each seismic region can be regarded as a basic earthquake-generating feature controlling the seismicity of the area (see Figure 2 below).
Intraplate earthquakes occur in a discrete layered medium whose hierarchical
structure has been determined by past geological processes, being ultimately
controlled by Neogene-Quaternary and present-day tectonic movements. The
size of the interacting lithospheric and crustal blocks outlined by active
faults or shear zones controls the upper magnitude limit, while their number,
rank and the intensity of tectonic movements control the mean number of
seismic events occurring per unit time. The fault rank Ji,
the distance dj between their
junction nodes and the size of the geoblocks are controlled by the thickness
and strength of the respective layers which have been subjected to faulting
during geological epochs. A larger layer broken into blocks by faults,
will be characterized by larger and longer faults, larger interfault (internodal)
distances dj and larger geoblocks,
and hence by higher magnitude earthquakes (here M is the Russian
MLH). Conversely, thinner layers contain smaller faults,
but the numbers of faults, geoblocks and earthquakes increase. The mean
distance dM (km) between closest
epicenters with magnitude in the range ![]() M=
± 0.2 (corresponding to the distance
dj between junction nodes
with rank Ji) is described by the following equation:
M=
± 0.2 (corresponding to the distance
dj between junction nodes
with rank Ji) is described by the following equation:
|
|
|
The relation between source length LM (km) and magnitude
M is given by:
|
|
|
The factor 0.6 in front of M shows that the source length LM and the respective distances dM and dj become about twice as large at every 0.5 magnitude step. It follows from (1) and (2) that d/L » 3.63 is invariant with magnitude and reflects the self-similarity in the hierarchy of geoblock and earthquake source sizes over the entire magnitude range investigated (M=6-8).
The active faults and their parameters were obtained from the database for the ILP Project II-2 "World Map of Major Active Faults" compiled by Trifonov and Machette (1993).
Seismicity
Earthquake Catalogue
The earthquake catalogue for Northern Eurasia prepared for GSHAP is the "Special Earthquake Catalogue of Northern Eurasia From Ancient Times Until 1995" (SECNE). A more detailed earthquake catalogue has been compiled for the Caucasus test area, covering the period from 2000 BC until 1993 AD (Shebalin and Tatevossian, 1997). Compared to the previously published earthquake catalogues covering the territory of former USSR (Kondorskaya and Shebalin, 1982; Earthquakes in the USSR, 1962-1991), SECNE is specific in that:
Seismicity mapping
It is essential for the identification of earthquake-generating features
and for the assessment of their seismic potential to map earthquake sources
in accordance with their dimensions and orientations, rather than as "point"
sources. These parameters are determined from several data sets, such as
aftershock distribution, surface ruptures, higher intensity isoseismals,
earthquake mechanisms, geodetic measurements and tectonic analyses. According
to the relations and the legend proposed by Ulomov (1974), earthquake sources
of M³ 7 are shown with realistic size and
orientation at map scale as ellipses having long L and short W axes, derived,
similarly to the conventional diameters L for smaller earthquakes, from
empirical formulas that are calibrated to correspond for M=6.5:
|
logW = 0,15M + 0,42 logL/W = 0,45M - 2,92 |
(3) |
|
|
In Figure 2 we show the map of seismicity, the seismic regionalization and the seismic domains for Northern Asia. Earthquake sources are listed in the SECNE Catalogue for Northern Eurasia. Different symbols identify different classes of events: M³ 8.0± 0.2 (large ellipses, 200 km long); M=7.5± 0.2 (medium ellipses, 100 km long); M=7.0± 0.2 (small ellipses, 50 km long); M=6.5± 0.2 to M=3.5± 0.2 at intervals of 0.5 magnitude units (circles of decreasing diameter). Symbols are colored to indicate depth: red - h£ 70 km, green - 70<h£ 300 km, blue - h>300 km.
The main regions of Northern Eurasia (1 - East Europe; 2 - Central Asia; 3 - Central Siberia; 4 - East Asia) are subdivided in several seismotectonic regions characterized by specific, quasi-homogeneous seismicity and seismic regime: 1.1 - Iran-Caucasus-Anatolia; 1.2 - Carpatho-Balkan; 1.3 -Baltic area; 1.4 - East Europe; 1.5 - Ural; 1.6 - Novaya Zemlya; 2.1 - Pamir - Tien Shan; 2.2 - Central Kazakhstan; 3.1 - Altai-Saiany-Baikal; 3.2 - West Siberia; 3.3 - East Mongolia; 4.1 -Kurils-Kamchatka; 4.2 - Sakhalin-Japan; 4.3 -Amur R. area; 4.4 - Verkhoyansk; 4.5 - Severnaya Zemlya; 4.6 - Chukotka. The regions 1.1, 1.2, 2.1, 3.1, 4.1-4.5 cover boundary regions between large lithospheric plates and have very high seismic activity. The coordinates of these regional classification are given in Table 1.
The top curve in Figure 3 shows the cumulative distribution with depth of all continental events with magnitude M³4, grouped in 0.5 magnitude steps (from 4± 0.2 to 7.5± 0.2); the other curves in Figure 3 correspond to earthquakes in individual magnitude classes. The hypocentral depth increases for larger magnitudes, corresponding to the equation log h = 4.05 log Ms - 2.15.
Determination of the seismic regime
The influence of hypocentral depth can be invoked also to explain the non-linear trend of the logarithmic frequency-magnitude relations (Gutenberg-Richter) for seismic activity in continental regions of North Eurasia.
In the Figure 4a we show the mean annual frequency magnitude relation
VRM for intracrustal events in the main continental regions
of Northern Eurasia (numbering as in Figure 2) and we derive the normalized
regression (of the form logVRM = logV4 - b(M-4))
for the exponential part (M=4 to 6) of the frequency-magnitude relation
for each region:
| 1.1: lgVM=1.68-0.97(M-4) | 2.1: lgVM=2.00-1.01(M-4) | 3.1: lgVM=1.42-0.97(M-4) |
| 4.2: lgVM=0.69-0.86(M-4) | 4.3: lgVM=0.53-0.91(M-4) | 4.4: lgVM=0.74-0.95(M-4) |
| 4.6: lgVM=-0.04-0.83(M-4) |
In Figure 4b we fit the ratio between the observed annual rates of seismic events with M³6.5 and the rates estimated on the basis of the linear relationship estimated above. The actual frequency of occurrence for earthquakes of M³7.0 is 3-5 times larger than expected on the basis of the linear fits. This is especially clear when the data are processed using the maximum likelihood method.
This phenomenon can to a first approximation be explained by crust and upper mantle stratification: larger ruptures cannot fit in the overlying layer and begin to involve the underlying layers, having different strength properties. This phenomenon should be taken into account in the parameterization of source zones and the assessment of earthquake hazard.
Earthquake Source Zones
We consider four structural levels of Seismic Source Zones (SSZ). The main structural unit of global seismicity is the region. Each region then include three types of seismic structures: lineaments, domains and potential earthquake sources. These features are the main components of the Lineament-Domain-Focal model (LDF- model) (Figure 5).
Seismic lineaments constitute the "frame" of the LDF model and are, in general, the shallow expression of deep-seated, 3D, pronounced earthquake-generating features. They delimit geoblocks with poorly differentiated tectonic movements and reveal boundaries between geoblocks exhibiting high contrast in tectonic activity. Lineaments are identified by cluster analysis of the space-time distribution of earthquake epicenters of relevant magnitude, from the analysis of geophysical fields and their gradients, from satellite photographs, from similaries in the Cenozoic and Quaternary tectonic evolution histories, and from other parameters of neotectonic and present-day geodynamics. Of special importance for the study of the present-day evolution of faults and lineament features is the dating of major paleo-earthquakes. Lineaments may strike in very diverse azimuths, controlled by the tectonics of the region, and may intersect each other, which "automatically" enhances the seismic hazard of their junction nodes. The length of the lineaments governs the maximum possible magnitude (Mmax) generated by them and establishes their rank.
Domains are represented as quasi-homogeneous seismotectonic areas (provinces) which do not contain identified lineaments. In contrast to lineaments, domains do not intersect or overlap (some apparent overlap may occur for domains that belong to different depths).
Potential earthquake sources are mostly confined to lineament segments or junctions, and are identified by various methods (from surface ruptures, dominant inter-epicentral distances, pattern recognition techniques etc.). Their dimensions are related to the magnitude of their respective maximum potential earthquakes.
Seismic source zones are here classified, similarly to earthquakes, according to the 0.5 magnitude steps. The upper magnitude threshold Mmax is controlled by the actual seismotectonic and seismogeodynamic setting, while the lower Mmin is determined by the completeness of reporting for small earthquake; here the values Mmin=4.0 and Imin=5 are adopted. Mmax is estimated from the dimensions of paleoruptures, archeological and historical investigations, from the width of zones of dynamic influence for earthquake-generating features, the length of seismogenic faults and lineaments, the dimensions of interacting geoblocks, from bends in recurrence curves, from extreme values in the plot of accumulated strain in earthquake-generating features and from the dimensions of potential earthquake sources.
The LDF source model has been parameterized to adequately take into account the annual seismic rates VR in the region, using non-exponential frequency-magnitude distributions of events. These properties had been ignored by compilers of previous seismic zoning maps and as a result, the return period of large earthquakes had been wrongly estimated. Each type of structure is considered as an independent seismic source and the regional seismic rates for different magnitudes cover structures of all types and ranks.
For each genetically homogeneous seismic region (typically 2500-3000 km long and 500- 1000 km wide), we use a regional earthquake catalogue purged from aftershocks and adopt a Poissonian model to describe the seismic process at least within the current period of seismic activity in the region. For each magnitude range we determine the mean annual rate taking into account the corresponding period of reporting completeness. We assume that at regional scale (we use 1:2,500,000 and smaller) the M³6.0 events belong to lineaments and potential sources, while those of M£5.5 to domains.
In Figure 6 we show the distribution of seismic rate and potential magnitudes in the elements of the LDF model: lineaments, domains and potential focal sources. All lineaments whose potential magnitude exceeds the Mmax under consideration are summed. For example, for the magnitude range DM=6.0¸ 8.5 the total length of the M=6.0± 0.2 lineaments also includes the length of all M³7.0± 0.2 lineaments. Domain parameterization proceeds in a simpler way, by constructing recurrence curves based on a sample of the regional catalog for each domain. The logarithmic regressions curves are almost always linear in the low magnitude range of the domains (M=4 to 6), in contrast to segments where high magnitude events are involved (cfr. Figure 4).
Potential sources of high magnitudes are most frequently related to seismic lineaments. This determines the technique to be employed for their seismological parameterization. However, since potential sources are expected to also generate earthquakes with a fixed Mmax, the length of potentially hazardous segments is taken into account only when the total seismicity is rearranged among lineaments of the same rank only. The value of Mmax for potential sources may equal or exceed the Mmax of the corresponding lineament.
The role of potential sources remains significant, because on these segments the flow of seismic events with Mmax, hence the seismic hazard, increases due to the activity of the source itself and to the activity of the corresponding lineament segment. Taking into account migration along lineaments and the previous history of seismic events in a potential source, one can accordingly increase (or diminish) the estimated probability of a next earthquake occurring at the source, by superposing several segments or leaving a gap at a given location on the main lineament.
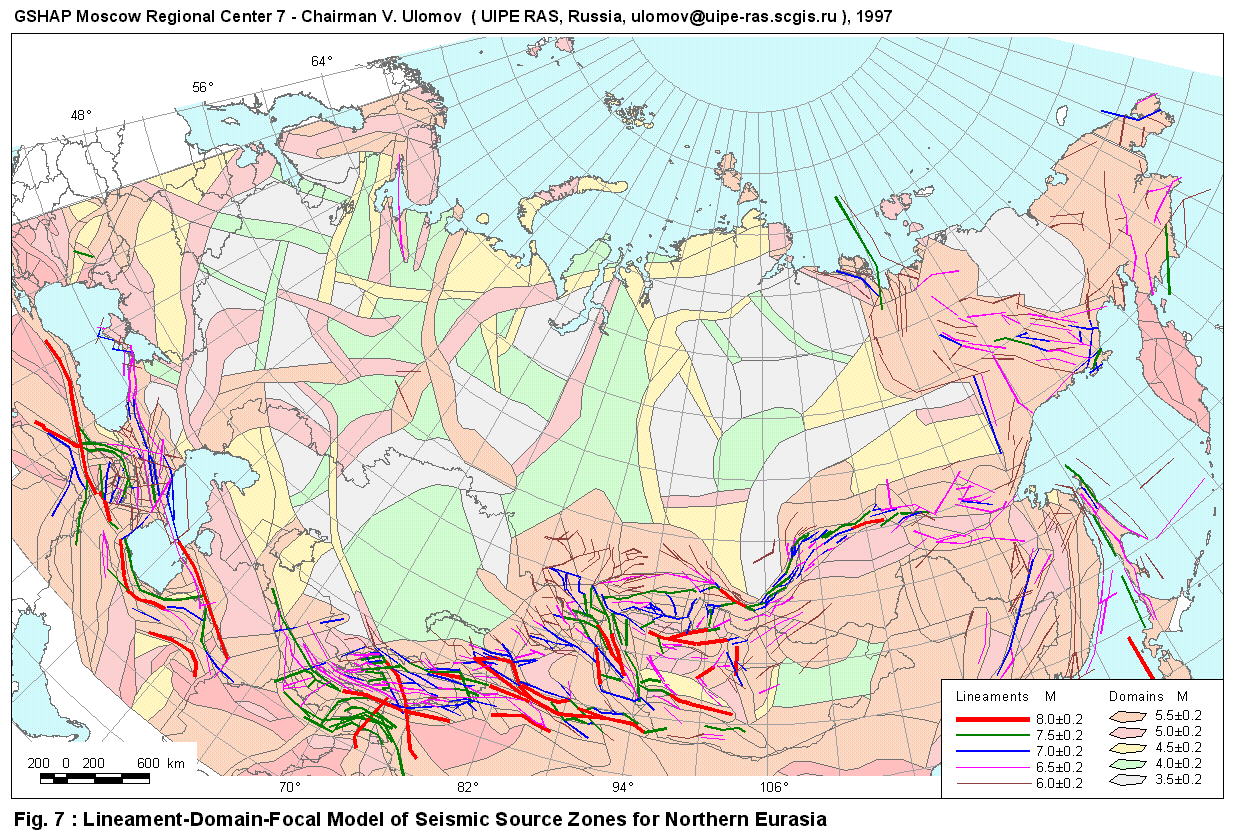
In Figure 7 we show the Seismic Source Zones of Northern Eurasia, including the lineaments of the LDF model (the continuous lines represent lineaments of decreasing magnitude rank), the domain component (thin lines mark conventional boundaries between domains having different seismicity behaviors) and the potential sources of the LDF model (the segments of potential earthquake sources with M=7.0-7.5 were determined only for the Northern Caucasus, Central Asia and Altay-Saiany regions, on the basis of pattern recognition analysis data by Reissner and of the inter-epicentral distance analysis by Ulomov). In total, 580 lineaments with M³6.0 were identified for Northern Eurasia (on a scale 1:2,500,000), including more than 1000 segments, 442 domains with M£5.5 and 11 potential foci with M=7.0-7.5. We also estimated the statistical deviation of the earthquake locations and magnitudes from the values expected from the LDF model.
Figure 8 illustrates an example of synthetic seismicity for the Crimea-Caucasus-Kopetdagh GSHAP test area, generated for a long interval of time (50 thousands of years) by propagating the long-term average seismic rate in the region as modeled by the LDF model. The scatter of smaller earthquakes out of the lineaments ensures a smooth transition from the rigid lineament structure to domains with distributed, smaller seismicity. Each single earthquake source is modeled by a rectangle with length scaled to magnitude and geographical scale and width accounting for the inclination of the lineament to the surface. Macroseismic epicentres (the centers of the rectangles) are distributed evenly along the lineaments, so that finite sources may stretch out of the lineament by up to half of their lengths, and are distributed normally across lineaments, with variance depending on magnitude rank.
The idea of modelling all seismicity only with homogeneous source zones with evenly scattered seismicity (our "domains") cannot be justified on physical grounds, since it does not preserve the physical understanding of the seismogenic potential of lineaments for high magnitude earthquakes. The domain model, however, needs to be used for smaller earthquakes, for lack of sufficient knowledge concerning the fine structure of the seismogenic structures. Our hybrid lineament-domain model of earthquake source zones satisfies both conditions.
Two more reasons exist not to replace entirely the lineament model by areal domains for seismic zoning purpose:
- the decreased area of the domains, irrespective of the dimensions of the rupture of large earthquakes, will result in an overestimate of the repeat times of large seismic events, hence in an underestimation of seismic hazard;
- the increased area of the domains capable of generating high magnitude earthquakes will make seismic zoning maps «fuzzy», and hence produce errors of the «false alarm» type.
The lineament-domain-focus model (LDF) for seismic source zones is free from these disadvantages, because it neatly differentiates the space-time-energy characteristics of regional seismicity and models the distribution of earthquakes for both high and moderate magnitudes.
Strong Ground Motion Relations
The Intensity-Distance-Magnitude relationship is modeled using a simple theoretical model calibrated using observed macroseismic data. At moderate distances, it coincides with the average relationships derived for the whole Northern Eurasia by Blake-Shebalin, while in the vicinity of the source this formula overestimates observed intensity. The model proposed by Gusev (1984) eliminates this problem and describes consistently the amplitude saturation near a fault. The elongated shape of the largest isoseismals is also modeled.
The scatter of intensity points with respect to the adopted attenuation
relationships is produced by source radiation variability and by propagation
path and near-receiver structural effects. These are modeled as two normal
distributions with zero mean and standard deviations of s
=0.5 and s =0.8 respectively, as estimated from
observed macroseismic data distributions. The moment magnitude Mw
is used in all calculations; its values for catalogue data are estimated
from empirical non-linear relationship.
Seismic Hazard Computation and Zoning
We calculate seismic hazard using an algorithm and software code designed by Gusev, Pavlov and Shumilina, following the principles of Riznichenko (1965) and Cornell (1968). The critical elements of the technique used are as follows:
Discussion of Hazard Results
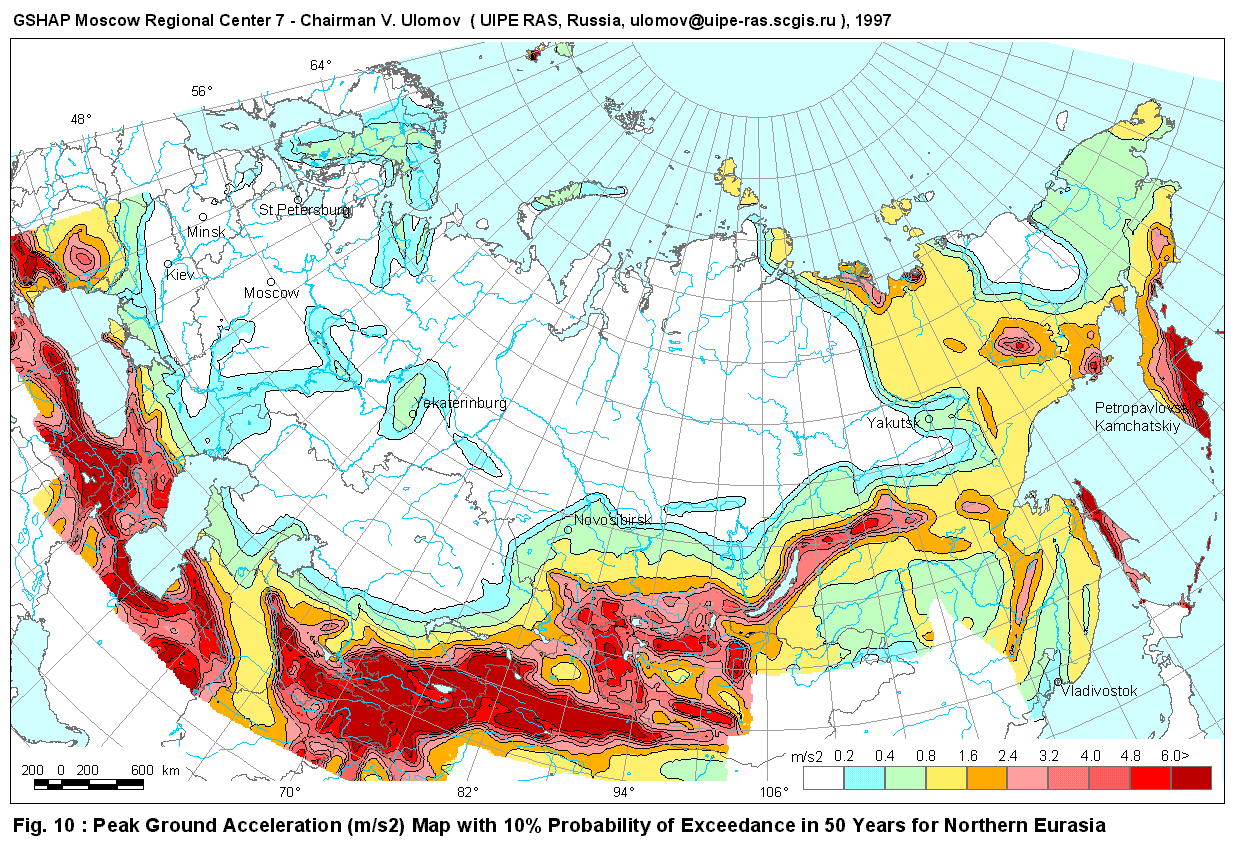
The final GSHAP seismic hazard map of Northern Eurasia in shown in Figure 10, depicting peak ground acceleration (m/s2) expected with 10% exceedance probability in 50 years. PGA is converted from intensity using the empirical relationship
log A(m/s2) = 0,333 IMSK - 2,222
obtained on the basis of the Aptikaev and Shebalin (1988) correlation to take into account also the effects of extended seismic sources. The calculation grid for I474 and accordingly for A474 values is 25x25 km2 for the whole Northern Eurasia.
Finally, this map is now adopted as the new map of General Seismic Zoning
(GSZ-97) for the FSU territory, expressed for the first time in terms of
peak ground acceleration, while traditionally only intensity maps were
produced in the FSU. This new map better reproduces the hazard conditions
of the FSU territory with respect to previous zoning and is the basis for
the complete set of maps (10%, 5% and 1% probabilities in 50 years) now
accepted as the normative documents for the new Building Code of Russia.
Acknowledgments
This work was performed with support of the Russian Federal Research Program «Global Changes of Environment and Climate» under Project «Seismicity and Seismic Zoning of Northern Eurasia», Coordinator V. Ulomov) and of the GSHAP (Coordinator D. Giardini).
For the Caucasus area, the work was conducted with support from INTAS (Ct. 94-1644) and NATO (ARW N.95-1521), in cooperation with bordering countries (M. Ghafory-Ashtiany, IIEES, Tehran, Iran; M. Erdik, Bogazici University, KOERI, Istanbul, Turkey) and with European institutions (D. Giardini, ING, Rome, Italy; G. Grunthal, GFZ, Potsdam, Germany; D. Mayer-Rosa, ETH, Zurich, Switzerland).
In Central Asia, the work was done in joint cooperation with the Chinese Seismological Bureau of Beijing and the work of Mengtan Gao is gratefully acknowledged.
The authors express special gratitude to L. Shumilina and N. Medvedeva
for the technical assistance and to A. Gusev and V. Pavlov for the seismic
hazard algorithms and software.
References
Arias A. (1970): A Measure of Earthquake Intensity, Seismic Design for Nuclear Power Plants, MIT Press, Cambridge Mass.
Cornell C.A. (1968): Engineering seismic risk analysis, Bull. Seis. Soc. Amer., 58, 1583-1906.
Earthquakes in the USSR (1962-1989): Annual proceedings, edited by N.V. Kondorskaya, Moscow, UIPE RAS.
Giardini D. and P. Basham (1993): The Global Seismic Hazard Assessment Program (GSHAP), Annali di Geofisica, 36, 3-13.
Gusev A.A. (1984): Descriptive statistical model of radiation of seismic source and its application to an estimation of a strong movement. Volcanology and seismology, 1, 3-22 (in Russian).
Gusev A.A., V.N. Melynikova (1990): Connections between magnitudes - global and for Kamchanka, Volcanology and seismology, 6, 55-63 (in Russian).
Kondorskaya N.V. and N.V. Shebalin (1982): New Catalogue of Strong Earthquakes of the USSR From Ancient Times Through 1977, World Data Center A, Colorado.
Medvedev S.V. (1947): To a question on the account of seismic activity of area with construction, Proceeding of the Seismological Institute, AN SSSR, N119 (in Russian).
Molchan G.M. and O.Ye. Dmitrieva: (1993): Purposeful Approach to the Program of Aftershock Identification, in "Seismicity and Seismic Zoning of Northern Eurasia", JIPE RAS, 1, 62-69.
Reissner G.I., L.I. Ioganson (1993): Seismic potential of western Russia, other countries of CIS and Baltic, Seismichnost i seismicheskoe raionirovanie Severnoi Evrazii, 1, Moscow, OIFZ RAN,186-195 (in Russian).
Riznichenko Yu.V. (1965): From the activity of seismic sources to the intensity recurrence at the ground surface, Izv. AN SSSR, Fizika Zemli,11, 1-12 (in Russian).
Shapira A. (1983a): Potential earthquake risk estimations by application of a simulation process, Tectonophysics, 95, 75-89.
Shapira A. (1983b): A probabilistic approach for evaluating earthquake risks, with application to the Afro-Eurasian junction, Tectonophysics, 91, 321-334.
Shebalin N.V., V.I. Ulomov, R.E. Tatevossian, V.G.Trifonov, A.I. Ioffe and A.I. Kozhurin (1995): Unified Seismogeological Taxonomy of the Northern Eurasia, Abstracts, IUGG General Assembly, Boulder, U.S.A.
Shebalin N.V. and R.E. Tatevossian (1997): Catalogue of strong earthquakes (M>=6.0) for the Global Seismic Hazard Assessment Program: test area of Caucasus, in "Historical and Prehistorical Earthquakes in the Caucasus", eds. D. Giardini and S. Balassanian, NATO ASI Series, Kluwer Academic Pub., 1-32.
Trifonov, V.G. and M.N. Machette (1993): The world map of major active faults project, Annali di Geofisica, 36, 225-236.
Ulomov V.I. (1974): Crust Dynamics of Central Asia and Earthquake Prediction, Tashkent, FAN, 215 (in Russian).
Ulomov V.I. (1987): A lattice model of source seismicity and the prediction of seismic hazard, Uzbek. Geol. Zhurnal, 6, 20-25 (in Russian).
Ulomov V.I. (1992): Program of Research on Seismicity and Seismic Zoning of Northern Eurasia, JIPE RAS, 9-21.
Ulomov V.I. (1993): Regional seismicity structures and some aspects of seismic zoning in Eurasia, Proceedings of PRC/USSR workshop on Geodynamics and seismic risk assessment, Beijing, Seismolog. Press, 283-301.
Ulomov V.I. (1994): Structural and dynamically regularity of Eurasia seismicity and some aspects of seismic hazard prediction, Proceedings, ESC XXIV General Assembly, 271-281.
Ulomov V.I. (1997): On the identification and seismological parameterization of earthquake source zones: the Caucasus and adjacent area, in "Historical and Prehistorical Earthquakes in the Caucasus", eds. D. Giardini and S. Balassanian, NATO ASI Series, Kluwer Academic Pub., 503-522.
Ulomov V.I. (1997): Seismological aspects in the parameterization of
seismic source zones for seismic hazard prediction, Journal of Earthquake
Prediction Research, 6, 159-180.
Figure 1. Block model of the EAST-97 methodology for seismic hazard assessment and seismic zoning adopted in this work.
Figure 2. Seismicity, Seismic Regionalization and Seismic Source Domains of Northern Asia (see also Table 1).
Figure 3. Depth distribution of earthquake hypocentres. The curves for the cumulative distribution and for individual magnitude classes are shown.
Figure 4. (a) Mean annual frequency magnitude relation VRM for intracrustal events in the main continental regions of Northern Eurasia (numbering as in Figure 2 and Table 1). (b) Ratio between the observed annual rates of seismic events with M³6.5 and the rate estimated on the basis of the linear trends in the lower magnitude band (4.0£M£6.0) in Figure 4a.
Figure 5. Diagram of the Lineament-Domain-Focal (LDF) model of earthquake source zones.
Figure 6. Distribution of seismic rates and potential maximum magnitudes in the elements of the LDF model: lineaments, domains and potential focal sources.
Figure 7. Lineament-Domain-Focal model of the seismic source zones of Northern Eurasia.
Figure 8. Synthetic seismicity for the Crimea-Caucasus-Kopetdagh test area of Northern Eurasia obtained by Monte-Carlo simulation with the LDF model (see text for details).
Figure 9. Distribution of earthquake sources with depth.
Figure 10. The GSHAP and GSZ-97 map of seismic
hazard of Northern Eurasia, depicting peak ground acceleration (m/s2)
expected with 10% exceedance probability in 50 years.
Table
Table 1. Seismic Regionalization of Northern Eurasia (see also Figure 2).
|
Nos. and names of sectors and regions
|
Goordinates of corners in the outlines
of
main sectors and regions (N-latitude and E-lon- gitude everywhere, except when marked W) |
|||
| 0- Northern Eurasia (general outline) | 90-20 | 44-20 | 44-22 | 40-22 |
| 40-30 | 34-30 | 34-80 | 40-80 | |
| 40-164 | 50-164 | 50-172 | 60-172 | |
| 60-168W | 90-168W | |||
| 1 - East Europe sector (general outline) | 90-20 | 44-20 | 44-22 | 40-22 |
| 40-30 | 34-30 | 34-62 | 74-62 | |
| 74-70 | 90-70 | |||
|
|
||||
| 1.1 - Iran-Caucasus-Anatolia | 48-30 | 34-30 | 34-62 | 48-62 |
| 1.2 - Carpathians | 50-20 | 44-20 | 44-22 | 40-22 |
| 40-30 | 50-30 | |||
| 1.3 - Baltic | 70-20 | 50-20 | 50-30 | 70-30 |
| 1.4 - Central-East Europe | 70-30 | 48-30 | 48-56 | 70-56 |
| 1.5 - Ural | 70-56 | 48-56 | 48-62 | 70-62 |
| 1.6 - Novaya Zemlya | 90-20 | 70-20 | 70-62 | 74-62 |
| 74-70 | 90-70 | |||
| 2 - Central Asia sector (general outline) | 54-62 | 34-62 | 34-80 | 40-80 |
| 40-102 | 44-102 | 44-90 | 46-90 | |
| 46-80 | 54-80 | |||
|
|
||||
| 2.1 - Pamir-Tien Shan | 46-62 | 34-62 | 34-80 | 40-80 |
| 40-102 | 44-102 | 44-90 | 46-90 | |
| 2.2 - Central Kazakhstan | 54-62 | 46-62 | 46-80 | 46-54 |
| 3 - Central Siberia sector (general outline) | 74-62 | 54-62 | 54-80 | 46-80 |
| 46-90 | 44-90 | 44-102 | 40-102 | |
| 40-124 | 58-124 | 58-110 | 76-110 | |
| 76-70 | 74-70 | |||
|
|
||||
| 3.1 - Altai-Sayany-Baikal | 58-80 | 46-80 | 46-90 | 44-90 |
| 44-104 | 48-104 | 48-124 | 58-124 | |
| 3.2 - Western Siberia | 74-62 | 54-62 | 54-80 | 58-80 |
| 58-110 | 76-110 | 76-70 | 74-70 | |
| 3.3 - Eastern Mongolia | 48-104 | 44-104 | 44-102 | 40-102 |
| 40-124 | 48-124 | |||
| 4 - East Asia sector (general outline) | 90-70 | 76-70 | 76-110 | 58-110 |
| 58-124 | 40-124 | 40-164 | 50-164 | |
| 50-172 | 60-172 | 60-174W | 90-174W | |
|
|
||||
| 4.1 - Kurils-Kamchatka | 58-146 | 44-146 | 44-140 | 40-140 |
| 40-164 | 50-164 | 50-172 | 60-172 | |
| 60-158 | 58-158 | |||
| 4.2 - Sakhalin-Japan | 58-140 | 44-140 | 44-146 | 58-146 |
| 4.3 - Amur R. Area -Primorye | 58-124 | 40-124 | 40-140 | 58-140 |
| 4.4 - Verkhoyansk | 76-110 | 58-110 | 58-158 | 76-158 |
| 4.5 - Severnaya Zemlya | 90-70 | 76-70 | 76-174W | 90-174W |
| 4.6 - Chukotka | 76-158 | 60-158 | 60-174W | 76-174W |